
Clustering or cluster analysis is the process of dividing data into groups (clusters) in such a way that objects in the same cluster are more similar to each other than those in other clusters. It is used in data mining, machine learning, pattern recognition, data compression and in many other fields. In machine learning, it is often a starting point. In a machine learning application I built couple of years ago, we used clustering to divide six million prepaid subscribers into five clusters and then built a model for each cluster using linear regression. The goal of the application was to predict future recharges by subscribers so operators can make intelligent decisions like whether to grant or deny emergency credit. Another (trivial) application of clustering is for dividing customers into groups based on spending habits or brand loyalty for further analysis or to determine the best promotional strategy.
There are various models and techniques for cluster analysis. When I first started, I was mistakenly searching for ‘the best clustering model or technique.’ I wasn’t aware that there is no universal best algorithm and the choice depends on your requirements and the dataset. There are density-based, graph based or centroid based clustering models. We finally settled on a clustering technique called k-means. This blog post is a brain-dump of everything I’ve learned about clustering and k-means so far.
K-means
K-means is a very simple and widely used clustering technique. It divides a dataset into ‘k’ clusters. The ‘k’ must be supplied by the users, hence the name k-means. It is general purpose and the algorithm is straight-forward:
We call the process k-means clustering because we assume that there are k clusters, and each cluster is defined by its center point — its mean. To find these clusters, we use Lloyd’s Algorithm: we start out with k random centroids. A centroid is simply a datapoint around which we form a cluster. For each centroid, we find the datapoints that are closer to that centroid than to any other centroid. We call that set of datapoints its cluster. Then we take the mean of the cluster, and let that be the new centroid. We repeat this process (using the new centroids to form clusters, etc.) until the algorithm stops moving the centroids.[0] We do this in order to minimize the total sum of distances from every centroid to the points in its cluster — that is our metric for how well the clusters split up the data.
Here’s an animation (from - broken link: http://simplystatistics.org/2014/02/18/k-means-clustering-in-a-gif/) showing how it works.
As far as its performance is concerned, k-means and its variants can usually process large datasets very quickly, as long as the number of clusters isn’t very high.
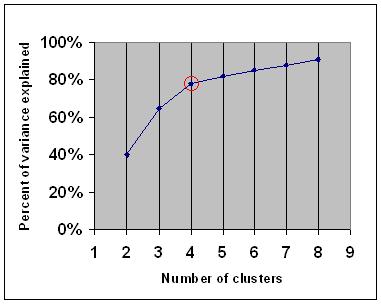
Finding ‘k’: number of clusters using the elbow method
If you know the number of clusters before hand, you have everything you need to apply k-means. However, in practice, it’s rare that the number of clusters in the dataset is known. When I’m modeling, I’m not sure if there are 3 clusters or 13 in the dataset. Luckily, there’s a technique called the ‘elbow method’ that you can use to determine the number of clusters:
One should choose a number of clusters so that adding another cluster doesn’t give much better modeling of the data. More precisely, if one plots the percentage of variance explained by the clusters against the number of clusters, the first clusters will add much information (explain a lot of variance), but at some point the marginal gain will drop, giving an angle in the graph. The number of clusters is chosen at this point, hence the “elbow criterion”.
Silhouette analysis is another popular technique for finding the optimum number of clusters visually, and the one we actually used in our application.
K-means limitations and weaknesses
Unfortunately, k-means has limitations and doesn’t work well with different types of clusters. It doesn’t do well when:
- the clusters are of unequal size or density.
- the clusters are non-spherical.
- there are outliers in the data.
I have read that the dataset must have well-separated clusters in order for k-means to properly work. However, in practice, I have experienced k-means doing a pretty good job of diving data up into clusters, even when the clusters are not well separated or obvious. I will keep it off the list.
1. The clusters are of unequal size or density
K-means won’t identify clusters properly if clusters have an uneven size or density. To illustrate the point, I generated a 2d dataset.
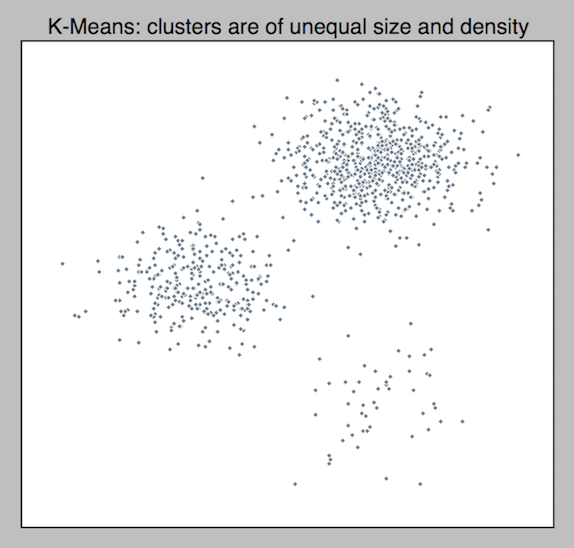
I see 3 clusters of uneven densities. Do you?
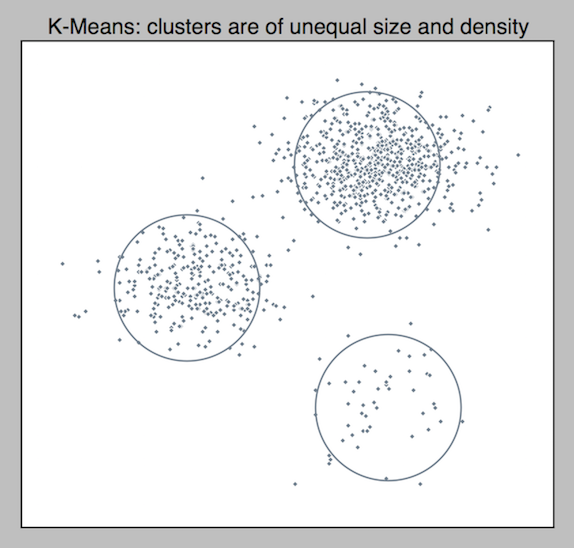
Let’s see how k-means does. I wrote a simple python script with scikit-learn and ran k-means with k=3.
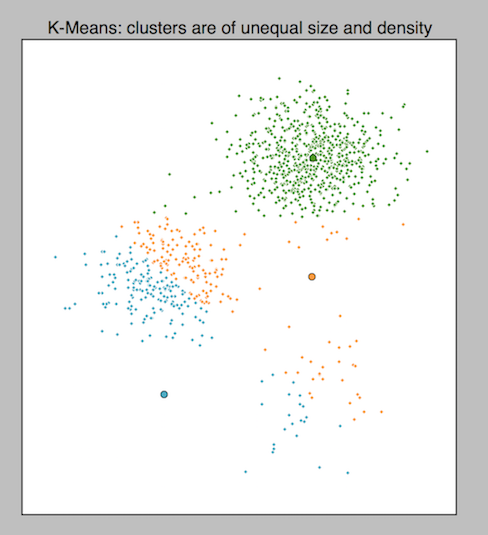
As it was expected, k-means messed up and couldn’t find naturally occurring clusters that we recognized in the dataset. It identified the larger cluster correctly but mixed the smaller ones. If you have datasets where naturally occurring clusters have unequal densities, try density based models.
2. The clusters are non-spherical
Let’s generate a 2d dataset with non-spherical clusters.
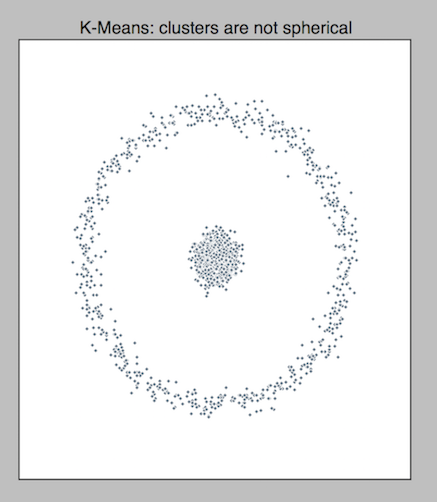
It’s how you look at it, but I see 2 clusters in the dataset. Let’s run k-means and see how it performs.
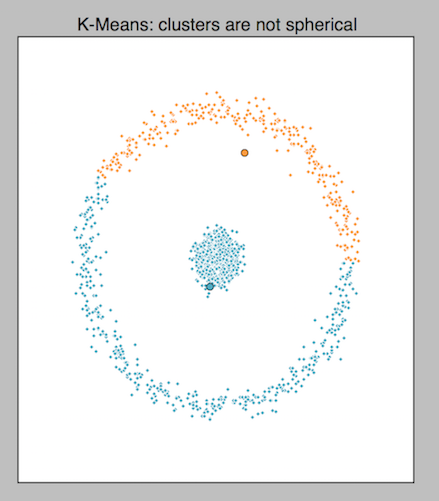
Looking at the result, it’s obvious that k-means couldn’t correctly identify the clusters. If you have a similar dataset, try a hierarchical or density based algorithm like spectral clustering or DBSCAN that are better suited.
3. There are outliers in the data.
If outliers are present in the dataset, they can influence clusterings results and change the outcome. The dataset should be pre-processed before applying k-means to detect and remove any outliers. There are many techniques for outlier detection and removal. Unfortunately, discussing these techniques is beyond the scope of this post and my expertise.
Evaluating k-means results
Let’s assume you have just applied k-means to a dataset. How do you tell if k-means did its job right and identified all clusters correctly? If your dataset is 2-dimensional and isn’t very large, you could probably plot the results and visually inspect to assess k-means, just like how I’ve been showing results to you so far. But what if your dataset is high-dimensional, as is often the case? We are trapped and can’t visualize data beyond 3-dimensions. So we need some way to evaluate result of k-means and there are a couple that I know of:
- Supervised evaluation
- Unsupervised evaluation
1. Supervised evaluation
Supervised evaluation can be used to check the results of k-means when you have a pre-classified dataset available that can act as a benchmark. Typically, an expert would carefully process a small dataset assigning datapoints to clusters manually. This is the gold standard for evaluation and tells us how close the results are to the benchmark. Keep in mind that in order to use supervised evaluation, you’d need to be able to train k-means and then supply the pre-classified benchmarks to check expectations against actual results (not possible if you are using a standalone app like Weka or Tableau). This page describes how to use supervised evaluation in scikit-learn, a popular python machine learning library.
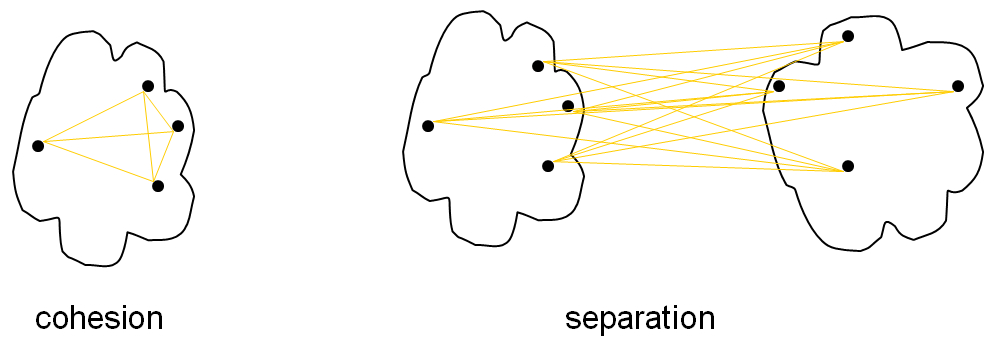
2. Unsupervised evaluation
Unsupervised evaluation doesn’t rely on external information. In our app, we used inter-cluster (within cluster sum of squares) and intra-cluster (between cluster sum of squares) variances to decide if the results were good enough. These are just fancy terms to describe cohesion of points that are within a cluster and separation between clusters. We want good cohesive clusters that are well separated from others.
For more information on, this wikipedia article has more information and describes several algorithms.
That’s everything I have learned about k-means and clustering in general. If you have any comments or want to suggest improvements to this post, please leave them in the comments section below.
Comments (1)
Tanya
Thank you, especially for your detailed description of the Lloyd algorithm. Cleared my confusion