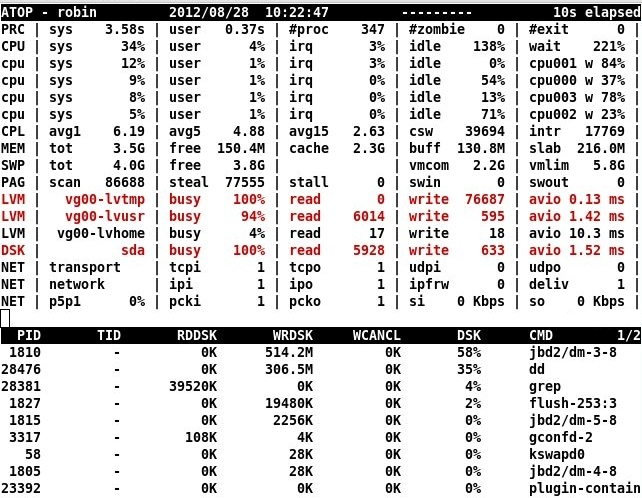
atop is a full-screen performance monitor for viewing system load. It shows the most critical hardware resources such as CPU, memory, disk and network. By default, it refreshes every 10 seconds.
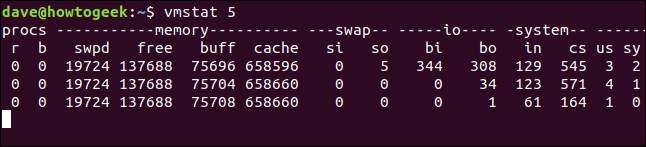
vmstat (virtual memory statistics) is a system monitor which provides activity information about processes, CPU, memory, block IO, paging and more. It is commonly used for displaying virtual memory statistics.
Let's see how atop and vmstat compare on various factors and features.
atop
vmstat
Overall
Type
Type
Interactive system-monitor, process-viewer and process-manager
Text based monochrome interface with the exception of highlighting critical resources in colors. Columns are shown based on the size of the window. Columns are dynamically added or removed as you enlarge or shrink the window.
User Interface
Command line ASCII output that is produced once and never updated by default. To make it update at regular intervals pass a numeric argument which acts as delay in seconds e.g. vmstat 3 updates every 3 seconds.
Scrolling Support
Scrolling Support
N/A
Scrolling Support
No
Mouse Support
Mouse Support
No
Mouse Support
No
Process utilization
Process utilization
Yes, shows all processes and threads.
Process utilization
No
Network Utilization
Network Utilization
Yes
Network Utilization
No
Disk Utilization
Disk Utilization
Yes
Disk Utilization
Yes with -d option
Comments
Comments
It is capable of reporting the activity of all processes (even if processes have finished during the interval), daily logging of system and process activity which can be collected and analyzed later.
Comments
Though it is very basic, it is a very handy tool for monitoring memory I/O and block activity.
Did we miss anything? Do you agree with the comparison? Please share your opinion or feedback below to help others. Thanks.