Related Books


Books / The basics of R / Chapter 2
Troubleshooting R and Finding Help
In our first tutorial, we learned how to import data into RStudio, conduct a simple analysis (calculate species richness) and plot the results. Not bad for a first time! If you need reminding of some programming terms, take a quick look at our glossary.
Programming comes with a learning curve and you will no doubt encounter many error messages while you familiarize yourself with the workings of R. But fear not! Today we will tackle some of the most common coding errors and help you avoid them. You might have seen some of these error messages already, but after completing this tutorial, we hope they won’t appear too often on your RStudio screens.
1. Learn how to pick up on errors in R
In addition to keeping a record of your code, scripts are also useful for detecting simple coding errors before you’ve even run the code. If RStudio picks up on a character missing, a command that doesn’t make sense due to spelling errors or similar, a little red x appears next to that line of code. Scanning your code for x’s before running it is always a good idea and it’s very convenient since you know exactly on which line you made a mistake. The other way R reports errors is through messages in the console, which appear after you run code that is not quite right. Although the error messages look scary (the red font and words like “fatal” sure give them a bad reputation), they are actually the second best option to no errors at all: R has identified there is a problem and from the message, you can figure out what it is and solve it!
2. Get familiar with common errors and solutions
Here we have compiled a list of mistakes we often make.
- Your version of
RorRStudiois too old (or too new). If you haven’t updatedRorRStudioin a while, you might not be able to use some of the new packages coming out - when you try installing the package, you will get an error message saying that the package is not compatible with your version ofRStudio. This problem is quickly fixed by a visit to the RStudio website or the R website, from there you can get the most recent version. On the flip side, when you get the newest RStudio, packages that haven’t been updated recently might not work, or your old code breaks. This occurs less often and in general, code is ever evolving and getting better and better, so it’s good to keep up to date with the latest versions of both RStudio and R packages. - Syntax errors. The easiest mistakes to make! You’ve forgotten a comma, opened a bracket, but haven’t closed it, added an extra character by mistake or something else
Rdoesn’t understand. Those are usually picked up by R and you will get error messages reminding you to proof-read your code and fix it. If you can’t pinpoint the correct way to code what you need, there are many places to find help. - You’re trying to use a certain function and R doesn’t recognise it. First, it’s worth checking whether you have installed and loaded the package the function comes from - running the code
?function-name, e.g.?filterwill display a help screen with information on how you use the function, as well as the package it comes from.
If you have loaded several similar packages from your library, they might contain different functions with the same name and your code might break if R is confused as to which one to use - running package::function, e.g. dplyr::filter will return information on the function in the console. Note that R will try to add () at the end of dplyr::filter. Delete them and run the code.
If you are reading up on R online, or copying and modifying code, you might be using a function from a new package without knowing. If it looks unfamiliar, googling its name with “r package” might reveal its origin. Sometimes packages depend on other packages to run. Often those get installed automatically when you install the package, but sometimes you get an error message asking you to install another package, easily solved by install.packages("newpackage").
- Function breakdown and debugging. If you are running self made functions or
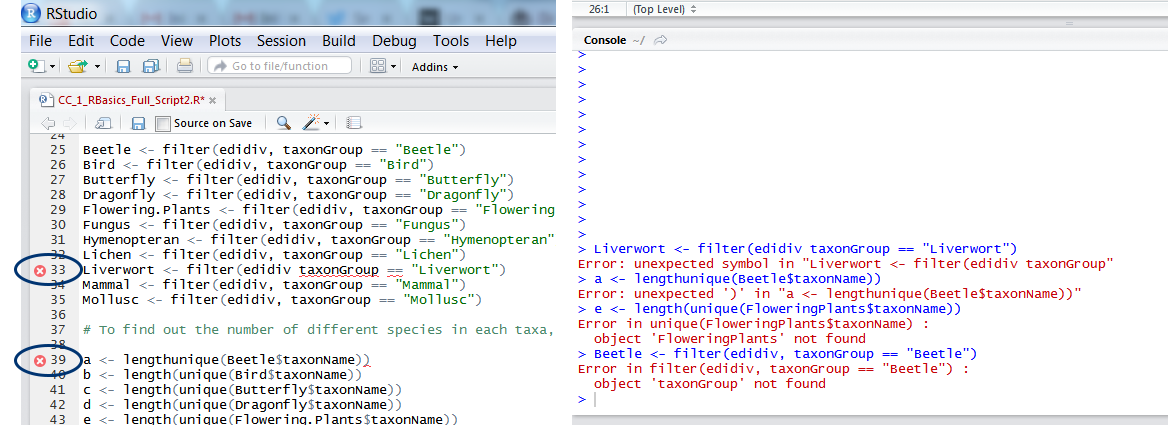
forloops, you might need to go through R’s traceback/debug browser. You can find help on RStudio’s Debugging Support Page. - Missing objects. Running tests and plotting data are often hindered by R failing to find the object it’s meant to analyse. When that happens, first check that your object names are correct: spelling mistakes (capital and lower case letters, wrong letters, etc.) can all make objects unrecognisable. In this code
e <- length(unique(FloweringPlants$taxonName))I asked R to calculate species richness of flowering plants, but forgot that I called the objectFlowering.PlantsnotFloweringPlants. Remember that when you refer to a certain variable from an object using the dollar sign, the object comes first, the variable second:Flowering.Plants$taxonGroup, nottaxonGroup$Flowering.Plants. - Data not in the right format. This might not necessarily result in an error message, but might lead to graphs/results that are wrong. For example, in our first tutorial we created a data frame and plotted species richness. If we had chosen a data matrix instead, that plot would have looked very different (and wrong). We use matrices when the variables are all the same type (all text, all numerical) and of the same length (same number of rows). Data frames are for when we have multiple variables of different types and vectors are for a series of numbers of the same type. If your results/plots make you feel suspicious, it’s good to go back to your data and check: did it import right into R, and is it in the right format? You can do this using
head()for a preview,str()to check the class of each variable, andsummary().
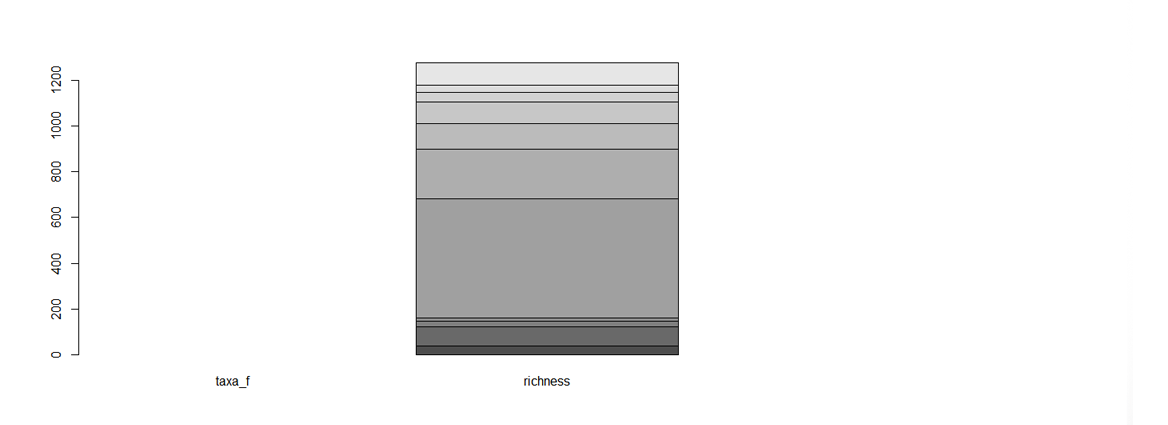
Figure 1. An unfortunate looking barplot! The data were chosen to be a data matrix, but, because in matrices all variables are of the same type, R expects taxa_f - the names of the different taxa - to have a numerical value, and lumps all the species richness values together in the second bar. A data frame was definitely a better choice!
- Wrong data distribution used in models. There are several reasons why models won’t converge, including the use of inappropriate distribution type. Usually we choose between normal (gaussian), binomial, Poisson, or Quasipoisson distributions.
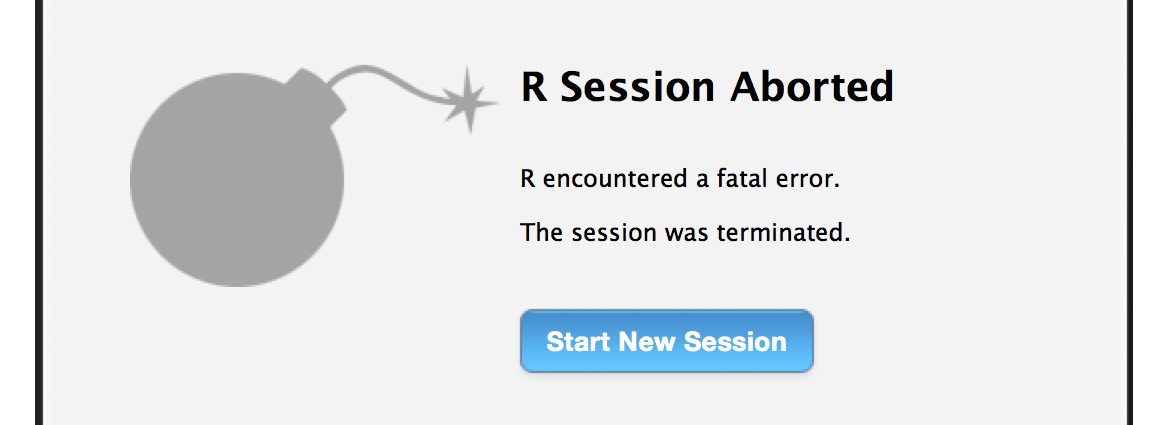
- R crashed! If you’ve overloaded
R, it can make a dramatic exit (bomb image and all) or sometimes it stops responding and you have to terminate the session. That’s why it’s very important to save your scripts often, but it’s better to save them as new files, e.g.Edi_biodiv_16thNov.R, instead of overwriting the same file. That way if you want to revert back to old code or use some part of it, it’s easy to find it. This is the most basic type of version control.
- Aaaah! I enlarged my plot, and now it’s full screen and I can’t get back! If you click on the little magnifying glass in the Plots window, it opens your plot in a new window that you can resize. Convenient! Less convenient is when you accidentally drag the window to the top of your screen and it goes full screen, blocking everything else. This is not an issue anymore with newer versions of R Studio, but if it ever happens, you can escape using the backspace key on your keyboard - and hopefully you don’t lose data in the process.
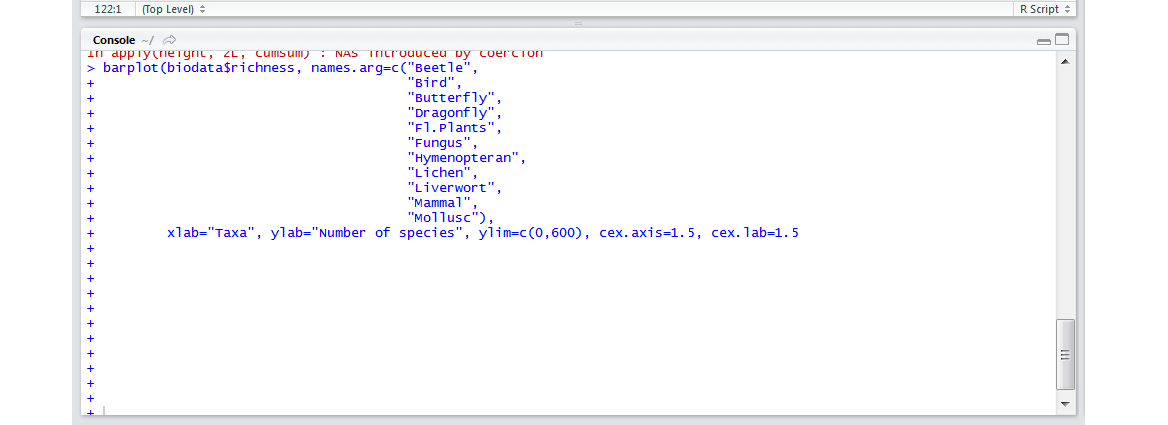
- I am stuck in a loop of pluses! If the numbers of opening and closing brackets don’t match up,
Rthinks there is more code coming. That is why, in the console, it is prompting you to add more code: every time you press enter, a new + appears. Press Escape on your keyboard to get back to the normal>prompt in the console and check your code to find your error.
- The cursor in the script file changed from
|to_and now text gets overwritten when I type. This happens when you accidentally press Insert on your keyboard and as a result when you add new text, it gets written over. Press Insert again to go back to normal.
Cheat sheet!
Here are some of the most common error messages you’ll meet when you get started, and what they actually mean:
- Error in
function-name(...): could not find function ‘function-name’ : This probably means that you are trying to use a function from a package you have not loaded. Type??function-name(or look it up online) to find out which package it comes from, and make sure the package is loaded usinglibrary(package-name). Which leads us to… - Error in
library(package-name): there is no package called ‘package-name’. : Did you install the package? Packages need to be installed once, usinginstall.packages('packag-name'), after which they can be loaded with thelibrary()command. - Error in
function-name(): object ‘object-name’ not found: R tells you that it cannot find an object that should be in your environment. First, make sure that you have an object with this name in your Environment panel. It could be just a typo, for instance you defined the object asbirds_nestsyet you try to plot it callingBird_nests. (And yes, R is also case-sensitive!) Or it could be that you haven’t actually run the code which creates this object yet! - Error: unexpected symbol in ‘line-of-code’ : Most likely you forgot (or had an extra!) comma, bracket or other punctuation sign somewhere.
- Cannot open file ‘your-file-path’: No such file or directory: R cannot find the file you are trying to load, often because you forgot to specify your working directory (we learned how to do it in our first tutorial, or because there is a mistake in your file path. (Hint: if you copied it from the Windows Explorer, you need to swap the backward slashes for forward slashes.) If you get object ‘your-file-path’ not found, then you probably forgot the quotation marks around the file path
read.csv(file = 'my-file-path/file.csv').
3. Learn how to find help
An online search for the error message (along with “R” and the function or package name) is always a good start. Chances are someone has already encountered that error and has asked about it online. If the error message is very long, try paraphrasing based on what you think the problem might be (and delete references to your specific objects and file names). There are several really useful online forums and websites where people ask for and receive help, such as Stackoverflow and Rbloggers.
For “how to …” type queries, a search will often result in tutorials, and even Youtube videos as well. For instance, “ ggplot how to change axis titles” or “dplyr filtering on two conditions” will quickly get you what you need.
R Help Of course, R has built-in documentation for all functions and packages. We already mentioned that you can type help() or ?function-name (try ??function-namefor a broader search). The RDocumentation website contains much of the same in a slightly nicer format, with examples and more links.
Of course, R won’t always tell you if you are doing something wrong: sometimes your code is correct, but you are doing the wrong type of analysis for your data. Nevertheless, making sure you avoid easy-to-make mistakes is a great place to start - even the fanciest, super-advanced tests can be brought down by a single missing comma.
A warning on warnings!
Errors are not the only scary red text that will appear in the console. Often, you will run code and get a message saying something like ‘There were 13 warnings, use warnings()to see them’. It could also be a specific warning telling you that R is ignoring NAs (missing) data in a plot, or that a function generated unexpected results such as NaN (not a number).
Warnings are not necessarily the end of the world, but you should see them as major red flags, and make sure you know what is going on before you pursue your analysis. Like error messages, a simple online search of the warning text will often put you on the right track.
4. Practice!
Practice truly is the best way to learn how to avoid errors in R - to get you started, we have written a purposefully wrong script - you can download the file from this Github repository. There you will find the data edidiv.csv, as well as the wrong (CC_2_RBasics_Wrong_Script.R) and right script. Can you fix all the mistakes?
Next up. we have a tutorial on Coding Etiquette! Developing code-writing routines and sticking to defined conventions is a good way to ensure uniform, mistake-free code that runs smoothly!