
htop is an interactive process viewer and system monitor. It’s one of my favorite linux tools that I use regularly to monitor system resources. If you take top and put it on steroids, you get htop.
htop has an awesome visual interface that you can also interact with using your keyboard. The screen packs a lot of information which can be daunting to look at. I tried to find a nice infographic to explain what each number, value or color coded bars mean, but couldn’t find any. Hence I decided to make one myself over the Christmas break.
When you first launch htop, you’ll be greeted with a colorful interface showing a list of all processes running on the system. These are normally ordered by the amount of CPU usage, ordered from highest to lowest. It also shows the status of CPU usage, physical and swap memory.
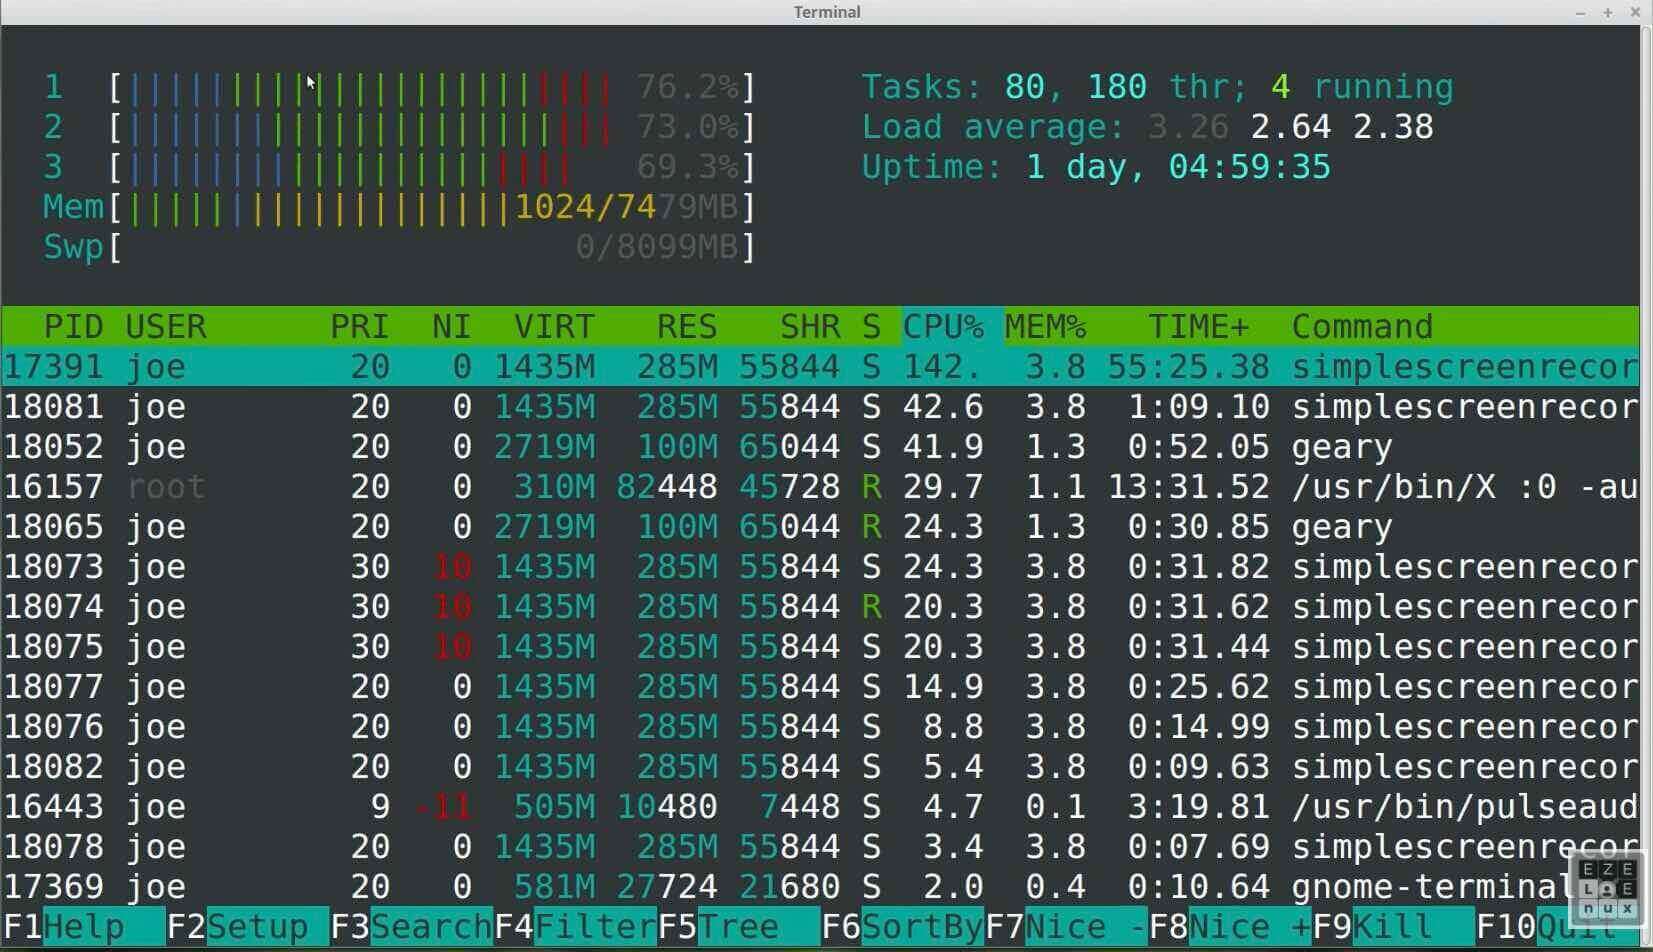
There’s a lot information in the screenshot. To explain, I’ve separated the interface into upper and lower sections so I have enough room to annotate. (If you want to know, I used Photoshop to annotate the screenshot.)
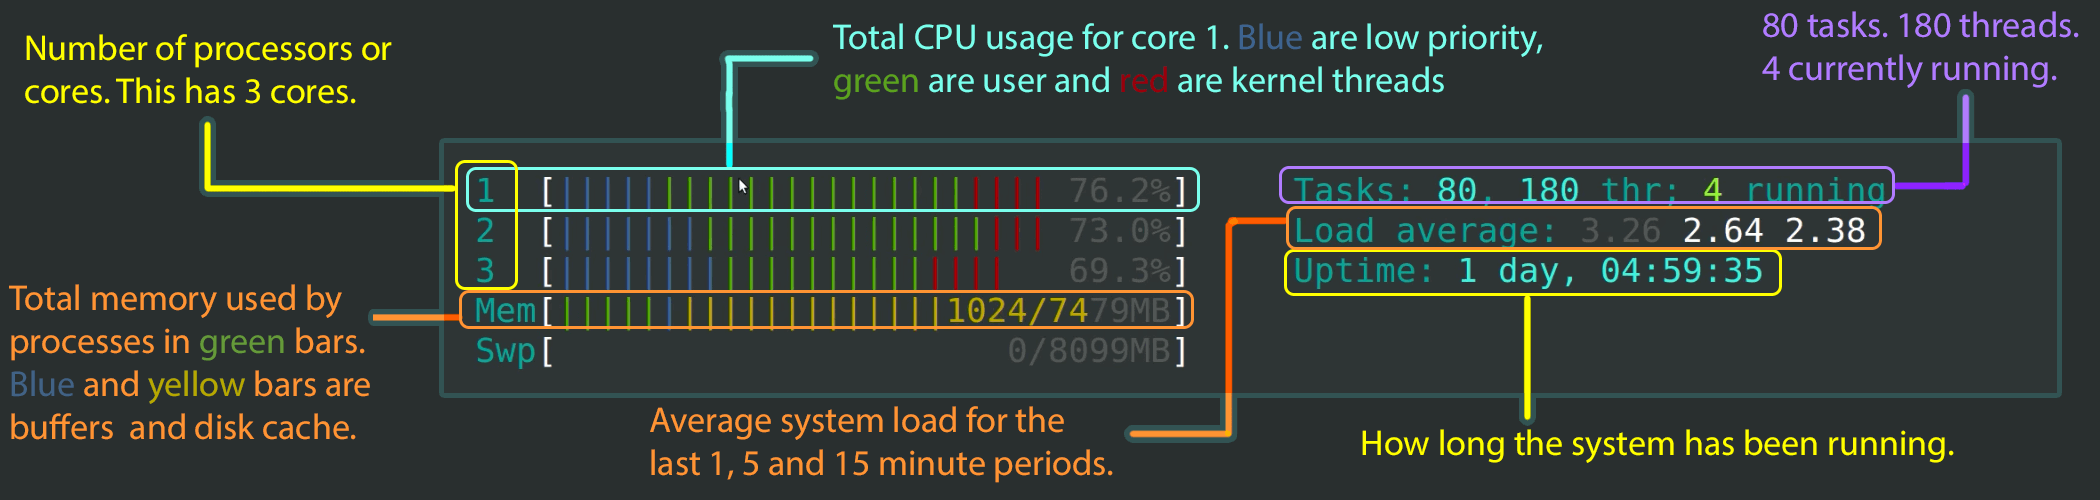
Let’s start with the upper section. To see higher resolution, please click on the image.
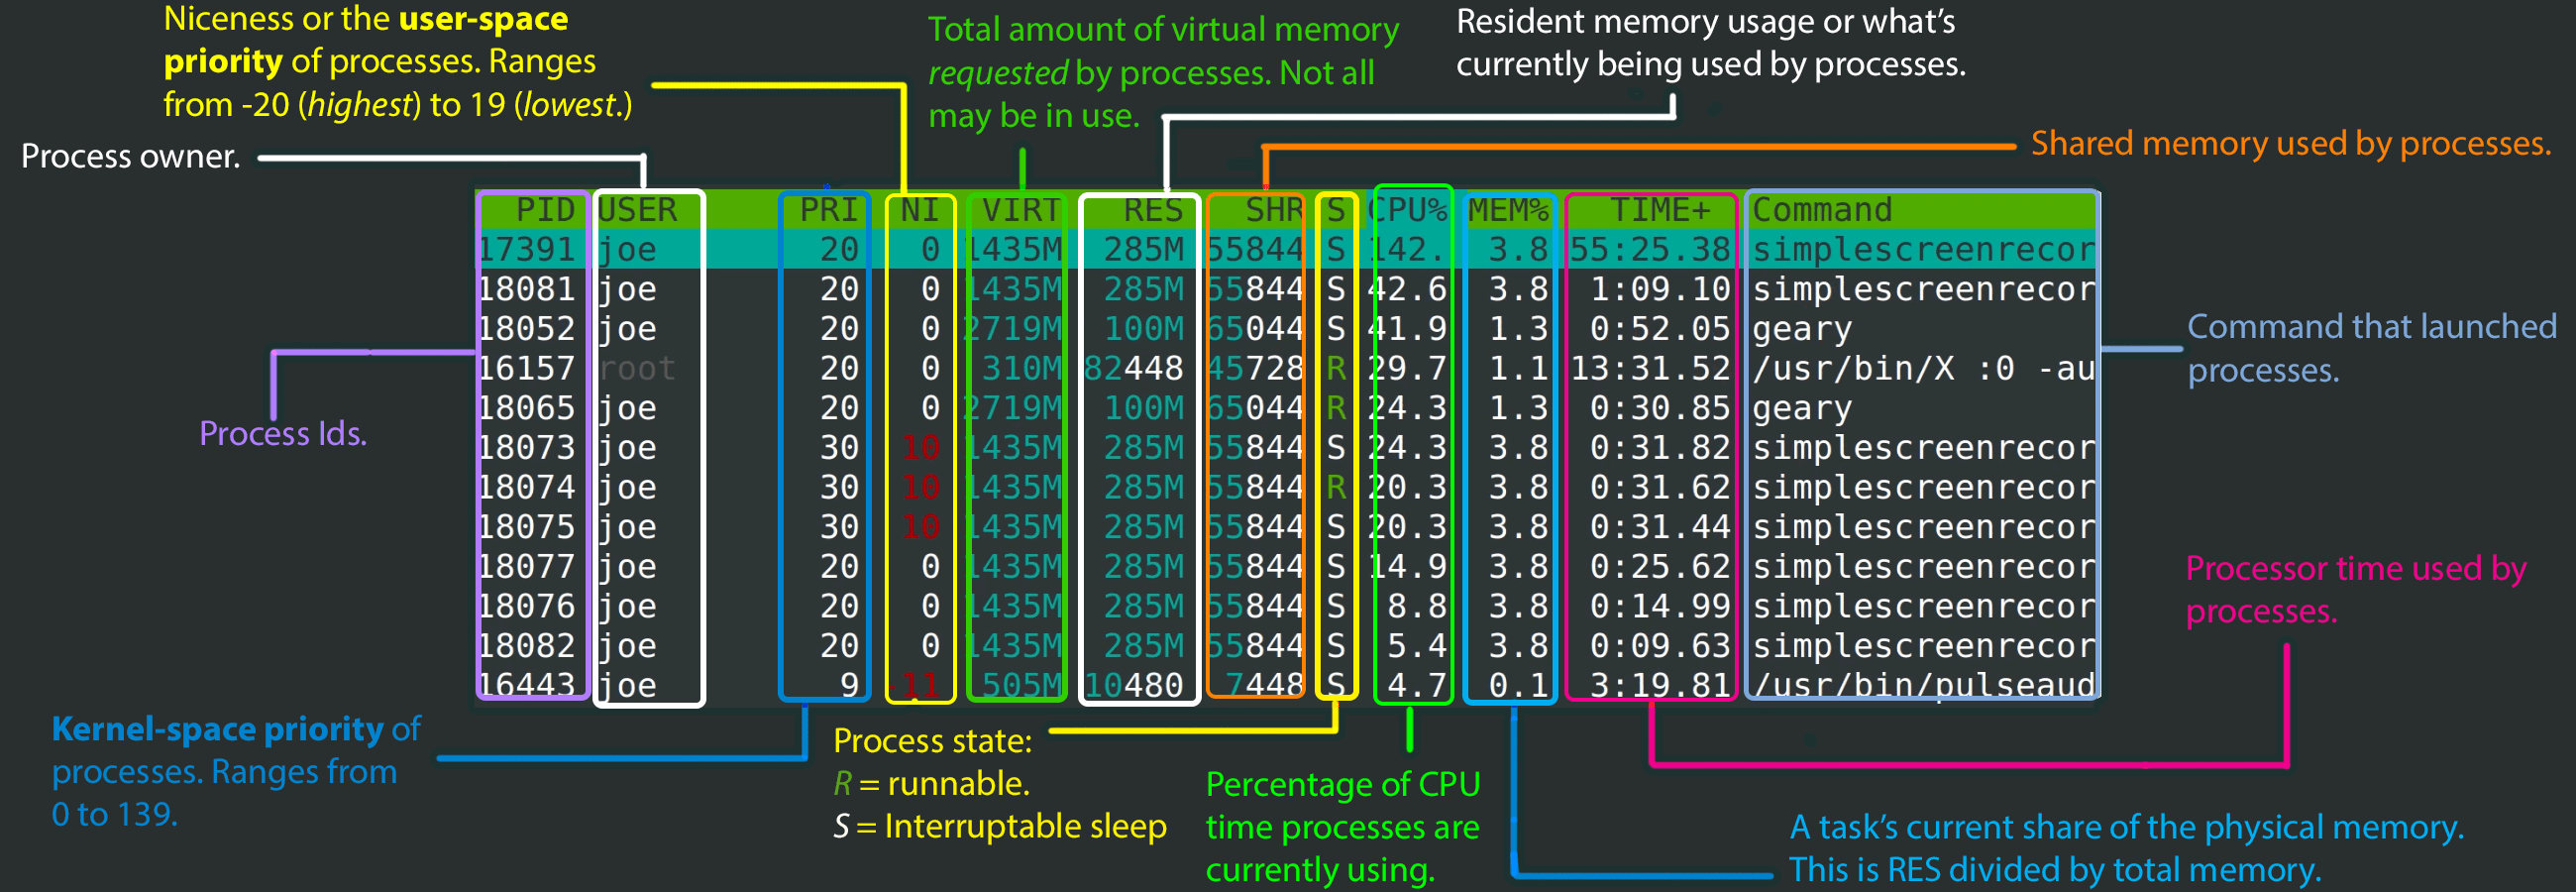
Here’s the lower section of htop.
I hope you found this post useful. Here’s a comparison between top and htop, comparing different features and properties.
If you are using macOS, please note that htop doesn’t come installed by default. You can install it easily using brew. Open the Terminal and type:
$ brew install htop
After the installation is complete, you can launch it by typing htop on the Terminal:
$ sudo htop
Note: sudo is needed to give htop required access on macOS. On Linux, sudo isn’t required.
Until next time.
Comments (20)
Nkansah Rexford
The visual representation is useful. Thanks
felipe
can you do this, for like every unix command in existence? like ls, top, etc? I loved the style!
Umer Mansoor
I hope this post and your comment inspire people to create visual explanations for other unix commands, especially those that pack a lot of information on one screen :)
Ellis Y
This is a great graph, Thanks. For years I figured the multi color bar was there to just look cool. Now I know :)
Robert
you forgot about the “Swp”. This is the size and usage of a swap file I guess.
Umer Mansoor
It was intentional: I don’t fully understand it. I think you are right that it represents the file-backed swap space. Using htop, I have noticed at times that the swap isn’t available or isn’t used even if the system runs out of physical memory. Sometimes, I see it being used when there’s plenty of physical memory still available. May be it’s a linux configuration…
If someone can provide me a brief and concise description of the “Swp” field, I’ll update the post.
osdap
I believe Swp is indeed simply swap space usage. The confusion is more likely a mismatch between your expectations of how swap works and how it really works.
The most common of these misunderstandings is seeing swap usage when there is plenty of physical memory. Modern Linux will start swapping out process memory in preference of cache use if configured to. So your overall application memory in use may be only 75% of available memory but Linux will swap some of this application memory out so that it can cache frequently used disk data. This is controlled by the “swappiness” parameter in Linux.
The other case is harder to address without more information. It should be very rare to run out of physical memory without hitting swap. It is possible if everything in RAM is considered unswappable but that is generally unlikely. Other than that, ulimit or application specific memory limits (e.g., Java’s memory limits) could also be a cause.
Konrad Zdanowicz
Very nice! Maybe a perfect compliment to this article would be a visual guide how to use basic functions, such as searching processes, sorting them and killing?
Kai Middleton
I tried brew install htop and it tells me:
htop requires root privileges to correctly display all running processes,
so you will need to run
sudo htop.You should be certain that you trust any software you grant root privileges.
kodisha
That is ok, you need sudo to display correct cpu info when on osx.
On linux you do not need sudo.
felixmontoY
This is on the front page of Hacker News. Not sure if you noticed.
Piotr Lewicki
This is very useful!
Not everything is fully explained, e.g. process status field can have values like:
S R D Z T W. In my opinion in such case you should add info that other values possible.
Thanks for the post :-)
thapakazi
good one,
how are you making those annotation borders, I wonder 🤔
Umer Mansoor
I used Photoshop :)
Ashish Wadekar
Thanks for the super cool visual explanation!
Also for Mac users, you can taste htop by installing it via homebrew, brew install htop and run it using command: sudo htop
David Okwii
Hey you can actually use http://explainshell.com/ to get an explanation on most Linux commands. It’s not as visual as this one, but equally useful
EmperorTerran .
memory yellow is not disk cache
its just cache
Deepak Singh
Nice explanation !!! Thanks
Luke
Great visuals to explain htop! This is really useful.
Chris Moltasanti
Tremendous explanation!