
- Knock, knock.
- Who’s there?
- …long GC pause…
- Java.

It’s an old joke from the time when Java was new and slow compared to other languages. Over time, Java became a lot faster. Today it powers many real-time applications with hundreds of thousands of concurrent users. These days, the biggest impact on Java’s performance comes from its garbage collection. Fortunately, in many cases, it can be tweaked and optimized to improve performance.
For most applications, the default settings of the JVM work fine. But when you start noticing performance issues caused by garbage collection and giving more heap memory isn’t possible, you need to tune and optimize the garbage collection. For most developers, it’s a chore. It requires patience, good knowledge of how garbage collection works and an understanding of application’s behavior. This post is a high-level overview of Java’s garbage collection with some examples of troubleshooting performance issues.
Let’s get started.
Java ships with several garbage collectors. More specifically, these are different algorithms that run in their own threads. Each works differently and has pros and cons. The most important thing to keep in mind is that all garbage collectors stop the world. That is, your application is put on hold or paused, as the garbage is collected and taken out. The main difference among the algorithms is how they stop the world. Some algorithms sit completely idle until the garbage collection is absolutely needed and then pause your application for a long period while others do most of their work concurrently with your application and thus need a shorter pause during stop the world phase. The best algorithm depends on your goals: are your optimizing for throughput where long pauses every now and then are tolerable or you are optimizing for low latency by spreading it out and having short pauses all along.
To enhance the garbage collection process, Java (HotSpot JVM, more accurately) divides up the heap memory into two generations: Young Generation and Old Generation (also called Tenured). There is also a Permanent Generation, but we won’t cover it in this post.
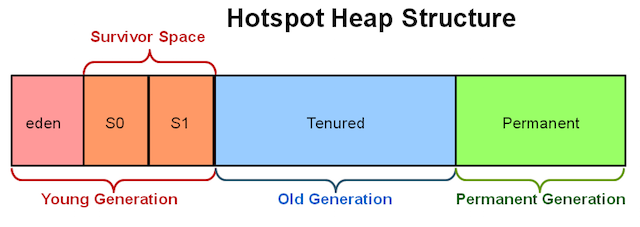
Young generation is where young objects live. It’s further subdivided into the following areas:
- Eden Space
- Survivor Space 1
- Survivor Space 2
By default, Eden is bigger than the two survivor spaces combined. On my Mac OS X with 64-bit HotSpot JVM, Eden takes about 76% of all the young generation space. All objects are first created here. When Eden is full, a minor garbage collection is triggered. All new objects are quickly inspected to check their eligibility for garbage collection. The ones that are dead, that is, aren’t referenced (ignoring reference strength for this discussion) from other objects are marked as dead and garbage collected. The surviving objects are moved to one of the empty ‘survivor spaces’. Which one of two survivor spaces? To answer this question, let’s discuss survivor spaces.
The reason for having two survivor spaces is to avoid memory fragmentation. Imagine if there was just one survivor space. While you are at it, also imagine survivor space as a contiguous array of memory. When young generation GC runs through the array, it identifies dead objects for removal. This would leave holes in memory where objects previously lived and compaction will be needed. To avoid compaction, HotSpot JVM just copies all surviving objects from the survivor space to the other (empty) survivor space so that there are no holes or empty spaces. While we are discussing compaction, please note that old generation garbage collectors (with the exception of CMS) perform compaction on the old generation section of the heap memory to defragment it.
In short, minor garbage collections (triggered when Eden is full) ping-pong live objects from Eden and one of the survivor space (known as the ‘from’ survivor space in logs) to the other (known as the ‘to’ survivor space). This happens until one of the following happens:
- Objects reach maximum tenuring threshold, in other words, have ping-pong’ed enough times that they aren’t young anymore,
- There is no room in survivor space to receive newly birthed objects (We’ll revisit this later.)
When this happens, objects are moved to the old generation. (There could be other conditions but I’m not aware of them.) Let’s try to understand with a real example. Suppose we have the following application that creates a few ‘long-lived objects’ during initialization and creates many short-lived during its operation. (E.g. a web server that allocates short-lived objects for each incoming request.)
private static void createFewLongLivedAndManyShortLivedObjects() {
        HashSet<Double> set = new HashSet<Double>();

        long l = 0;
        for (int i=0; i < 100; i++) {
            Double longLivedDouble = new Double(l++);
            set.add(longLivedDouble);  // add to Set so the objects continue living outside the scope
        }

        while(true) { // Keep creating short-lived objects. Extreme but illustrates the point
            Double shortLivedDouble = new Double(l++);
        }
}
Let’s enable garbage collection logs and other settings using the following JVM command line arguments:
-Xmx100m                     // Allow JVM 100 MB of heap memory
-XX:-PrintGC                 // Enable GC Logs
-XX:+PrintHeapAtGC           // Enable GC logs
-XX:MaxTenuringThreshold=15  // Allow objects to live in the young space longer
-XX:+UseConcMarkSweepGC      // Ignore for now; covered later
-XX:+UseParNewGC             // Ignore for now; covered later
The application logs showing the state before and after garbage collection are as follows:
Heap <b>before</b> GC invocations=5 (full 0):
 par new (<u>young</u>) generation total 30720K, used 28680K
  eden space 27328K,   <b>100%</b> used
  from space 3392K,   <b>39%</b> used
  to   space 3392K,   0% used
 concurrent mark-sweep (<u>old</u>) generation total 68288K, used <b>0K</b> <br/>
Heap <b>after</b> GC invocations=6 (full 0):
 par new generation (<u>young</u>) total 30720K, used 1751K
  eden space 27328K,   <b>0%</b> used
  from space 3392K,   <b>51%</b> used
  to   space 3392K,   0% used
 concurrent mark-sweep (<u>old</u>) generation total 68288K, used <b>0K</b>
From the logs, we can see a few things. The first thing to notice is that there have been 5 minor garbage collections before this one (total of 6.) Eden was 100% used which triggered it. One of survivor space is 39% used and as such has some room available. After the garbage collection is over, we can see that Eden went back to 0% and survivor space increased to 59%. This means that live objects from Eden and survivor space were moved to second survivor space and dead one’s were garbage collected. How can we tell that some dead objects were collected? We can see that Eden is much larger than survivor space (27328K vs 3392K) and since survivor space size only slightly increased, a large number of objects must have been collected. The old generation space stayed completely empty before and after the garbage collection (Recall that the tenuring threshold was set to 15.)
Let’s try another experiment. Let’s run an application that is only creating short-lived objects in multiple threads. Based on what we’ve discussed so far, none of these objects should go to the old generation; minor garbage collection should be able to clean them up.
private static void createManyShortLivedObjects() {
        final int NUMBER_OF_THREADS = 100;
        final int NUMBER_OF_OBJECTS_EACH_TIME = 1000000;

        for (int i=0; i<NUMBER_OF_THREADS; i++) {
            new Thread(() -> {
                    while(true) {
                        for (int i=0; i<NUMBER_OF_OBJECTS_EACH_TIME; i++) {
                            Double shortLivedDouble = new Double(1.0d);
                        }
                        sleepMillis(1);
                    }
                }
            }).start();
        }
    }
}
For this example, I’m gave the JVM only 10 MB of memory. Let’s look at the GC logs.
Heap <b>before</b> GC invocations=0 (full 0):
 par new (<u>young</u>) generation total 3072K, used 2751K
  eden space 2752K,  99% used
  from space 320K,   0% used
  to   space 320K,   0% used
 concurrent mark-sweep (<u>old</u>) generation total 6848K, used <b>0K</b> <br/>
Heap <b>after</b> GC invocations=1 (full 0):
 par new generation  (<u>young</u>)  total 3072K, used 318K
  eden space 2752K,   0% used
  from space 320K,  99% used
  to   space 320K,   0% used
 concurrent mark-sweep (<u>old</u>) generation total 6848K, used <b>76K</b>
Not what we predicted. We can see that this time, the old generation received objects right after the first minor garbage collection. We know that these objects are short-lived and tenuring threshold is set to 15 and this is the first collection. What happened is the following: the application created a large number of objects which filled up Eden space. Minor garbage collection ran and tried to collect garbage. However, most of these short-lived objects were active during the GC, i.e. were being referenced from a live thread and being processed. The young generation garbage collector had no choice but to push these objects to the old generation. This is bad because the objects that got pushed to the old generation were prematurely aged and can only be cleaned up by old generation’s major garbage collection which usually takes more time. With a particular GC algorithm that we’ll cover later, CMS, major GC is triggered when the old generation memory is 70% full. This default value can be changed with the -XX:CMSInitiatingOccupancyFraction=70 argument.
How to prevent premature aging of short-lived objects? There are several ways. One theoretical way is to estimate the number of active short-lived objects and size the young generation appropriately. Let us make the following changes:
- Young Generation by default is 1/3 of the total heap. Let’s change this using the -
XX:NewRatio=1which gives young generation more memory (~3.4 MB compared to the 3.0 MB the last time.) - Also increase the survivor space ratio using the
-XX:SurvivorRatio=1argument. (~1.6MB each compared to 0.3 MB the last time.)
The problem was fixed. After 8 minor garbage collections, the old generation space was still empty.
Heap <b>before</b> GC invocations=7 (full 0):
 par new generation   total 3456K, used 2352K
  eden space 1792K,  99% used
  from space 1664K,  33% used
  to   space 1664K,   0% used
 concurrent mark-sweep generation total 5120K, used <b>0K</b> <br/>
Heap <b>after</b> GC invocations=8 (full 0):
 par new generation   total 3456K, used 560K
  eden space 1792K,   0% used
  from space 1664K,  33% used
  to   space 1664K,   0% used [
 concurrent mark-sweep generation total 5120K, used <b>0K</b>
This is in no way an exhaustive method of tuning garbage collection. I’m simply trying to demonstrate the steps involved. For real applications, optimum settings are found as a result of trial and error with different settings. For example, we could have also fixed the problem by doubling the total heap memory size.
Garbage Collection Algorithms
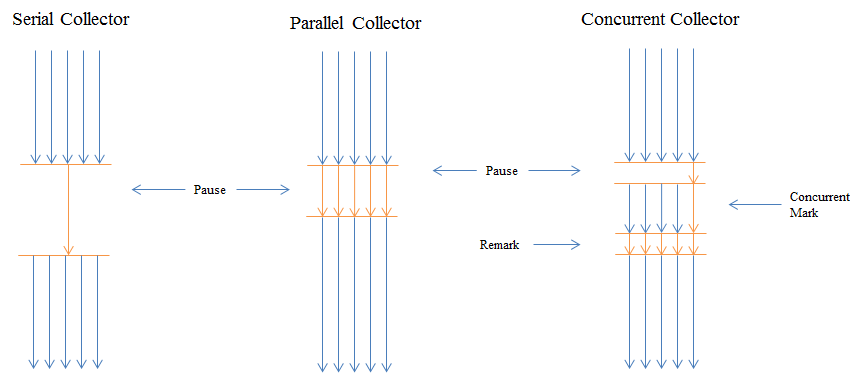
Now that we have covered generations, let’s look at garbage collection algorithms. HotSpot JVM comes with several algorithms for young and old generations. At a high level, there are three general types of collection algorithms, each with its own performance characteristic:
serial collector uses a single thread to perform all garbage collection work, which makes it relatively efficient because there is no communication overhead between threads. It is best-suited to single processor machines -XX:+UseSerialGC.
parallel collector (also known as the throughput collector) performs minor collections in parallel, which can significantly reduce garbage collection overhead. It is intended for applications with medium-sized to large-sized data sets that are run on multiprocessor or multithreaded hardware.
concurrent collector performs most of its work concurrently (for example, while the application is still running) to keep garbage collection pauses short. It is designed for applications with medium-sized to large-sized data sets in which response time is more important than overall throughput because the techniques used to minimize pauses can reduce application performance.
HotSpot JVM allows you to configure separate GC algorithms for young and old generations. But you can only pair up compatible algorithms. For example, you cannot pair up Parallel Scavenge for young generation collector with Concurrent Mark Sweep for old generation collector because they are not compatible. To make it easier for you, I was going to make an infographic to show which garbage collectors are compatible, however, luckily I searched first and found one created by JVM engineer, Jon Masamitsu.
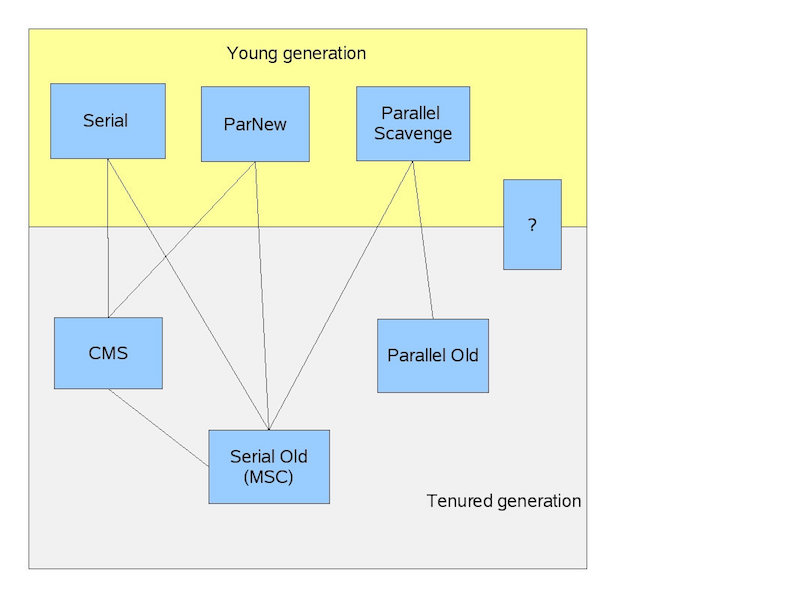
- “Serial” is a stop-the-world, copying collector which uses a single GC thread.
- “Parallel Scavenge” is a stop-the-world, copying collector which uses multiple GC threads.
- “ParNew” is a stop-the-world, copying collector which uses multiple GC threads. It differs from “Parallel Scavenge” in that it has enhancements that make it usable with CMS. For example, “ParNew” does the synchronization needed so that it can run during the concurrent phases of CMS.
- “Serial Old” is a stop-the-world, mark-sweep-compact collector that uses a single GC thread.
- “CMS” (Concurrent Mark Sweep) is a mostly concurrent, low-pause collector.
- “Parallel Old” is a compacting collector that uses multiple GC threads.
Concurrent Mark Sweep (CMS), paired with ParNew, works really well for server-side applications processing live requests from clients. I have been using it with ~ 10GB of heap memory and it keeps response times steady and GC pauses are short. Some developers I know use Parallel collectors (Parallel Scavenge + Parallel Old) and are happy with results.
One important thing to know about the CMS is that there have been calls to deprecate it and it will probably happen in Java 9 :’( Oracle recommends that the new concurrent collector, the Garbage-First or the G1, introduced first with Java, be used instead:
The G1 collector is a server-style garbage collector, targeted for multi-processor machines with large memories. It meets garbage collection (GC) pause time goals with high probability, while achieving high throughput.
G1 works on both old and young generation. It is optimized for larger heap sizes (>10 GB). I’ve not experienced G1 collector first-hand and developers in my team are still using CMS, so I can’t yet compare the two. A quick online search reveals benchmarks showing CMS outperforming G1. I’d tread carefully, but G1 should be fine. It can be enabled with:
-XX:+UseG1GC
Hope you found this post useful. Until next time.
Comments (20)
Jean
I think it did.
pedrorijo91
Nice article!
Just a few questions:
1- on the first example with GC logs you say objects were moved to second survivor space. Where do you get that information from? Or the GC just moves between the 2 survivor spaces every time?
2- on the second example, why do eden objects get moved into the old generation immediately? Why do they don’t get through survivor space?
Umer
Every time a minor GC happens:
- objects move from Eden and one of the survivor spaces to the empty survivor space first example (
createFewLongLivedAndManyShortLivedObjects)- objects that have survived many minor GC’s are moved to the old generation
- if there isn’t enough room in the young generation, objects can be prematurely pushed to old generation (second example)
Umer
The image I used to show “HotSpot Heap Structure” needs clarification: The ‘Permanent Generation’ was replaced by ‘Metaspace’ in Java 8. Although I didn’t discuss Permanent Generation in the post, the main difference between it and the Metaspace is that Metaspace can dynamically resize (grow and shrink). Here’s more information: https://stackoverflow.com/q…
Chandrasekhar
hi,
Good Article, Sometime leak happen long time after. how can I detect memory leaks in applications?
Umer
I wish detecting memory leaks was simple. In my latest project, it took us (2 people) a couple of days to identity a very slow leak.
Profiling helps. I use YourKit, but any profiler should do. Reduce the max memory size and put your application under load. Observe memory profile. If the old generation space continues to build up slowly and doesn’t go down, you may have a memory leak. Enable ‘object allocation recording’ and you may see which objects are being excessively created. Enabling verbose GC during troubleshooting also helps. https://www.yourkit.com/jav…
These are just heuristics of course. Understanding the java memory model helps when you are investigating. You can also use static code analyzers that may identify things like
String.intern(), unclosed streams or connections, and largestaticobjects.Surya b
Good information. One of the key features of G1 Garbage collector is its ability to limit the GC pause time (i.e. you can set the desired maximum pause time) without compromising on throughput.Garbage collection
visitor
thanks. very detailed and enriching.
I think you have a typo:
stranger
+1
Gajendra Jangid
Really liked the insight provided on this topic.
pvillela
Great explanation, thanks!
Anoop SN
Great efforts !
sgnsajgon sgnsajgon
Hi,
Regarding code example no.2 (method createManyShortLivedObjects), I don’t understand one thing - we have 100 threads, each thread has only one Double instance referenced at time because the each subsequent loop iteration overrides reference, so the Double instance from previous iteration becomes inaccessible. The size of Double instance is 8, so we have referenced 100 * 8 = 800 bytes of memory at time. So how it happens that young generation becomes full?
winster jose
Hello,
what if major GC is not running? Should we see a gradual increase in ‘Old Gen used’ memory? I have a situation where one application is creating performance issue. Initial analysis suggested 2 things. First, minor GC takes around 10 seconds per minute( 0.4-0.5 seconds per one minor GC). Second, major GC is not running. Because of this behavior, used memory is piling up and eventually ends up in restarting the server. But I could find a strange behavior. Though I expected a continuous increase in the used memory, I could see a small decrease in the used memory in a random manner. Could you please explain this behavior? Will objects move from Old Gen to Young Gen in any case?
Ignacio Catalán
Illustrative, useful post, thank you.
Amritpal
Very useful post. Thanks a lot!
Shaqode o Steal
Such a brilliant article.
Shaqode o Steal
Such a brilliant article.
NS
Awesome article!!!!
Khaer Mohammad
Best article on garbage collector I have read so far.