Related Books


Books / Ruby for Beginners / Chapter 39
Debugging a program
Debugging is a process of fixing bugs when you interact with active program rather than just only looking into a source code. When computers were quite simple, there was no need for a sophisticated debugger. Programmers used to write a code and look at results. If results were fine, then program was fine.
You probably won’t need a debugger for a simple program as well. However, when complexity grows, the probability of introducing a bug grows too. If you have only one “if...else” statement, you have only two code branches. With two such statements you multiple two by two. With three statements multiple this number again by two (4 * 2 = 8). In other words, for three statements we have eight combinations of a program flow. For ten “if...else” statements this number is 1024! And we’re not considering user input.
In other words, the number of ways a program might get executed grows exponentially, while the complexity of the program grows linearly. And the probability of introducing error increases over time.
In real life programmers tend to debug programs the same amount of time they spend on creating these programs. That’s why it is crucial to understand how debugger works, and how to debug a program.
There are multiple ways of debugging a Ruby program, for example:
- By using output to the console (with methods like “
puts” and “print”) - By using text console debugger
- By using built-in graphical debugger integrated into interactive development environment (IDE)
Let’s take a closer look at these options in this chapter.
Debugging by using output to console
It is one of the most efficient and easiest ways to debug a program. In any part of a program we can say:
puts something.inspect
“inspect” method is implemented for every object. It returns string representation of an object. One might ask “why to use “puts something.inspect” while we always can “puts something”?
Inspect is more verbose, and its purpose is, yes, to inspect. For example, “puts nil” and “puts ""” statements put empty line on the screen. While having “.inspect” gives you a better idea of what it is:
$ pry
> puts nil

> puts nil.inspect
nil
> puts ""

> puts "".inspect
""
For programs that produce to your terminal lots of information (applicable to all Ruby on Rails application, for example) you might want to use the following trick:
puts '=' * 80
puts something.inspect
puts '=' * 80
Code above will print “=” eighty times and then inspection of the variable on the next line. You can easily spot this debugging statement in a lengthy output of other unrelated debug messages. Below is such example, we can see that our “something” variables equals to “123”:
   (11.7ms)  SELECT "schema_migrations"."version" FROM "schema_migrations" ORDER BY "schema_migrations"."version" ASC
Processing by HomeController#index as HTML
  Rendering home/index.html.erb within layouts/home
  Rendered application/_header.html.erb (Duration: 10.5ms | Allocations: 762)
   (7.0ms)  SELECT promises_stats.* FROM promises_stats
  ↳ app/models/promise.rb:17:in `amount_sum'
==================================================
"123"
==================================================
  Rendered application/_footer.html.erb (Duration: 1.3ms | Allocations: 166)
  Rendered home/index.html.erb within layouts/home (Duration: 4747.1ms | Allocations: 2147650)
Completed 200 OK in 4765ms (Views: 4745.9ms | ActiveRecord: 7.0ms | Allocations: 2149461)
To “stop the world” at a certain point you can use “raise” statement. Ruby will generate “standard error” exception and program will terminate (the Rails framework will terminate only current request):
puts '=' * 80
puts something.inspect
puts '=' * 80
raise
Ruby is dynamically typed language, and it’s not always possible to say where exactly this or another method is defined until you run a program. RubyMine IDE from Jetbrains (subscription based) has fantastic feature “Go to declaration” (usually Cmd+B shortcut on macOS and Ctrl+B on other operating systems). It allows you to jump to the place where method is defined. However, even sophisticated IDEs sometimes can’t understand where the method is defined because of dynamic nature of Ruby runtime.
In this case the following trick can be used:
puts method(:something).source_location
If object has method “something”, path will be displayed along with the line number.
When code gets executed multiple times, single debugging statement can pollute your screen, so having conditional “puts” is useful:
puts something.inspect if i == 100
Sometimes you want to print a stack trace. What is stack trace? Basically, the exact picture, evidence of how and why this particular line got executed. Use Ruby’s “caller” statement, here is example of a program that returns exponentiation for a random number:
def random_pow
  pow(rand(1..10))
end

def pow(x)
  puts "=" * 80
  puts caller
  puts "=" * 80
  x ** 2
end

puts random_pow
Result:
========================================================
-:2:in `random_pow'
-:12:in `<main>'
========================================================
64
Stack trace has backwards output. As we can see, the first execution is happening on line 12 where we call “random_pow” method. The next is on the second line where we call “pow” method. And inside “pow” method we print stack trace with “caller” statement.
JavaScript has similar syntax to print information to the console (also, this method can accept multiple parameters):
console.log(some_variable);
“console” object also implements “dir” and some other methods that look similar and useful for debugging:
console.dir(some_variable);
You can’t debug Ruby programs with JavaScript, but it’s always useful to compare implementation. We’ll look closer into this option in the next chapters.
Debugging by using console debugger
We’re already familiar with Pry, which is another REPL (read-execute-print-loop). Pry implements more features rather than IRB (Interactive Ruby, standard REPL). With a little bit of extra effort Pry can be used as a console debugger. We’ll look into basics of debugging with Pry. Knowing how to use this tool will save you a lot of time.
If for some reason Pry is not installed on your system yet (you can check it with “which pry”), type simple installation command:
$ gem install pry pry-doc
This command installs two gems: “pry” and “pry-doc”. Last one is a plugin for “pry” (normally plugin names for Pry start with “pry-“ prefix) and contains documentation about native Ruby methods.
You can type Pry commands once Pry is executed with just typing “pry” in your terminal:
$ pry
> help

Help
  help               Show a list of commands or information about a specific command.

Context
  cd                 Move into a new context (object or scope).
  find-method        Recursively search for a method within a class/module or the current namespace.
  ls                 Show the list of vars and methods in the current scope.
  pry-backtrace      Show the backtrace for the pry session.
  raise-up           Raise an exception out of the current pry instance.
  reset              Reset the repl to a clean state.
  watch              Watch the value of an expression and print a notification whenever it changes.
  whereami           Show code surrounding the current context.
  wtf?               Show the backtrace of the most recent exception.

(and so on...)
You can get help for any command from the list above by adding “-h”, for example:
[1] pry(main)> whereami -h
Usage: whereami [-qn] [LINES]

Describe the current location. If you use `binding.pry` inside a method then
whereami will print out the source for that method.
...
Look at the Ruby program that is supposed to raise a number to the second power, so for 2 result is 4, for 3 result is 9, for 4 is 16, and so on (this operation equals to multiplying number by self one time):
def random_pow
  pow(rand(1..10))
end

def pow(x)
  x ^ 2
end

puts random_pow
Can you spot anything wrong above? Looks pretty legit: it generates random number and raises the number to the second power. However, it is weird. Give it a try. For example, it prints 6 when it shouldn’t. Program can print only 1, 4, 9, 16, 25, 36, 49, 64, 81, 100.
The program was made intentionally with the bug. Can you spot it? It’s okay if you can’t, that’s why we need a debugger. Let’s try to debug it together by applying technique from the previous chapter “Debugging by using output to console”:
def random_pow
  pow(rand(1..10))
end

def pow(x)
  puts "Pow parameter: #{x}"
  x ^ 2
end

puts random_pow
We added line 6, and it is supposed to print the value we pass in into “pow” method. Here is the result of a sample run:
Pow parameter: 3
1
Hm… Very strange. Input parameter is 3. The second power of 3 is 9, not 1. What’s going on?
When program is simple enough, the answer is obvious. However, when program is huge, and it’s not easy to reproduce the bug with just running a program (for example, when you need to go though multiple steps like registration, email confirmation, and so on), debugging the program can be a hassle and can take some time.
Programmers say we “need to set a breakpoint”. When execution reaches to this certain point, the program will stop and will be ready for thorough investigation. By using some tools a programmer can try to find out what’s going wrong at this exact breakpoint, what variables are, what’s the parameters, how call stack looks like, and so on. In other words, there is going to be a context ready for review and manipulation, not only code and final result on the screen.
Let’s see how to set a breakpoint with Pry:
require 'pry'

def random_pow
  pow(rand(1..10))
end

def pow(x)
  binding.pry
  x ^ 2
end

puts random_pow
We’ve set a breakpoint by adding two lines (1 and 8). First line requires gem “pry” to be included. For performance reasons installed gems aren’t included in Ruby programs by default. so we need “require ...” statement. From Ruby’s standpoint Gem is just a side code written by some enthusiast. So when we say “gem install ...”, we download gems from Internet. And when we say “require...”, we include already downloaded gem from some default place in our local filesystem.
Highly likely that you’ll deal with Ruby on Rails (RoR) framework in the future, and it has “Gemfile” support by default. You just need to add your gem names to this file, and if it’s done correctly, RoR will load these gems automatically.
Line 8 in the listing above has “binding.pry” statement. It’s a special syntax indicating breakpoint: “stop the program at exactly this point and show debugger prompt”.
Note that before we were running Pry from the command line, but now we need to execute the program as we normally do:
$ ruby app.rb
Program started, Ruby found method definitions on lines 3 and 7 and the last line is the actual entry point which is “puts random_pow” (or “puts(random_pow)”, or “puts(random_pow())” - as you already know, parenthesis are optional). In other words, we want to put a string on the screen, and it should be result of “random_pow” method, so Ruby starts with executing “random_pow” first.
“random_pow” generates random number and calls “pow” where our breakpoint is:
$ ruby app.rb

From: /Users/ro/work/book/app.rb @ line 8 Object#pow:

     7: def pow(x)
 =>  8:   binding.pry
     9:   x ^ 2
    10: end

[1] pry(main)>
Arrow on the left shows where you are. You can type “whereami” Pry command to bring this screen back if you mixed up somehow and the listing has disappeared.
So now, instead of empty Pry state we had by running “pry” from the terminal, we are inside of a running program! We have the state of the interrupted program, with all its memory, initialized variables, parameters, and so on. So exciting, it’s like debugging a Robot and investigating what’s on its mind! Here is what we can do:
- See variables values (variable “
x” in our case) - We can change variable values
- We can call any method one or more times
- We can paste some code from the clipboard and see how it works
- We can execute the next line and go step by step gradually changing the state of a program
Some useful Pry commands are:
- “
next” executes the next statement (next line). After that you can read (and write) variables again. - “
exit” to continue execution of a program. This command tells Pry to exit back to the program. The better name for this command would be “continue”. - “
exit!” - hard exit, stop execution right now and go back to the terminal. - “
whereami” - where am I? Shows the debugger prompt with arrow pointing to the current line.
These are essential commands, and there is more (type “help” to see the list, but you probably won’t need them for this chapter).
So, how do we find the bug we were talking about? Let’s print “x” variable and then type in “x ^ 2” and see what happens:
[2] pry(main)> whereami

From: /Users/ro/work/book/app.rb @ line 8 Object#pow:

     7: def pow(x)
 =>  8:   binding.pry
     9:   x ^ 2
    10: end

[3] pry(main)> x
2
[4] pry(main)> x ^ 2
0
That’s rather interesting! We found that “x” equals to 2, and result of “x ^ 2” is zero. It is not something we expected. We expect to see 4, not zero. So we were able to identify the problem line. And there was no need to run the program multiple times.
Statement “x ^ 2” is syntactically correct, but in Ruby language it won’t raise the number to the second power. “^” operator is used to perform “exclusive-or”. But in some other programming languages it is “raise to the Nth power” operator, but in Ruby one should use “**” for that. Here is correct version of the program:
def random_pow
  pow(rand(1..10))
end

def pow(x)
  x ** 2 # THIS LINE HAS BEEN FIXED
end

puts random_pow
We’re familiar with Pry basics now. From now on, if you face a bug, you know what to do: set a breakpoint and go step by step examining your variables.
To conclude, there is another useful, but not very well known command: “system('reset')”. It’s not a Pry command: “system” is reserved Ruby method that runs a system command. And “reset” is command to reset your terminal settings to default (not to reset your computer). Typing “system('ls')” resulting in printing the list of files in current directory, and “system('pwd')” prints working directory (p.w.d.).
Running “man reset” in your terminal (manual for “reset” command) says “initialize a terminal…”
But why do we need it and why one would want to call “reset” from Pry? If you’re working on small programs you will probably never need it. However, large Rails applications have multiple gems which can inadvertently pollute your terminal and change its settings (for example, when you type, but don’t see yourself typing). Use “system('reset')” to bring back default terminal settings without restarting the terminal. You can also do it by omitting “system” and wrapping actual command in backticks:
[1] pry(main)> `reset`

(screen cleared)

""
[2] pry(main)> whereami
...
Debugging with IDE
Until now we’ve been using only console tools for debugging. Many programmers prefer to use console tools, not only debuggers, but also text editors like Vim, Emacs, and other application.
The advantage of console tools is that they work at any “host”: on developer’s computer or on remote Linux server (which often is used for purposes of serving clients, not for development). In other words, knowing how these tools work allows you to debug a program not only locally, but remotely as well, one needs only SSH connection.
However, convenience of IDE debugging has been deeply appreciated. Authors of this book do not use IDE debugging quite often, but it’s something definitely worth mentioning. Here is how RubyMine IDE looks like:
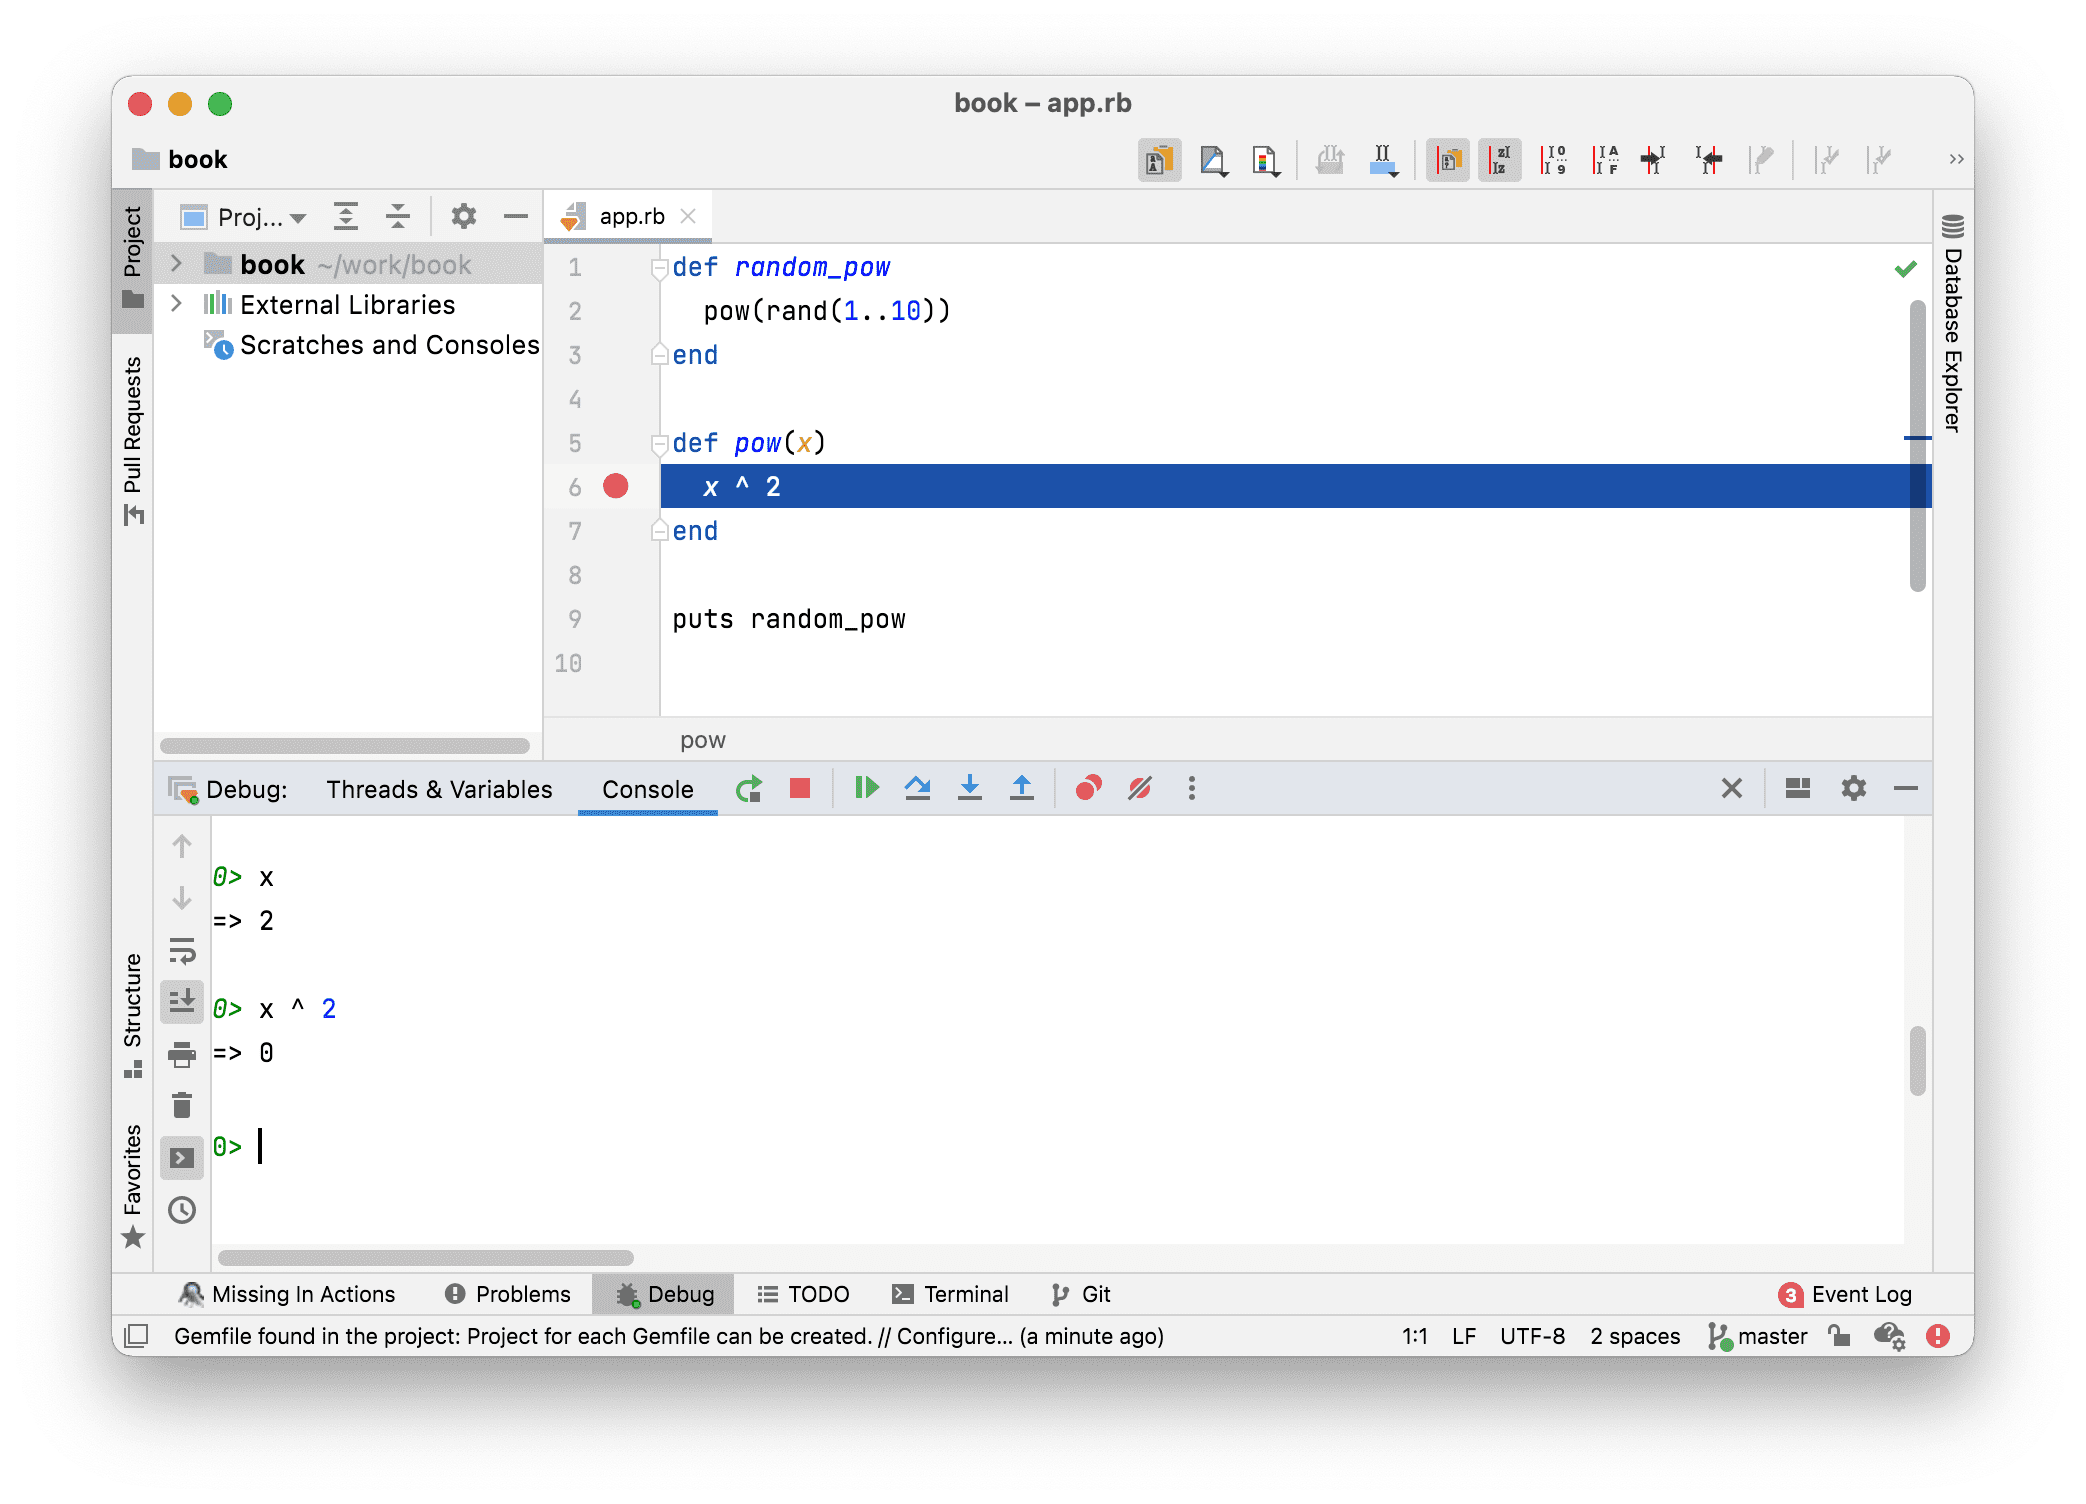
As you can see from the image above there is no need for “binding.pry” and “gem install pry”, normally IDE will take care of this magic. With a mouse pointer you can activate breakpoint: you’ll see the red circle on the left. You can also start debugging from the menu:
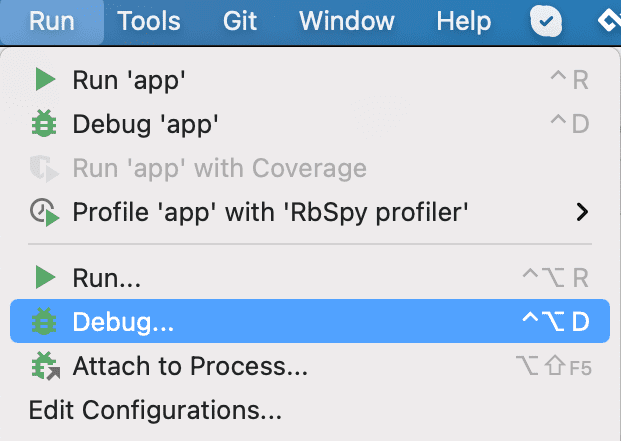
When debugger has been started and the flow of a program has been successfully interrupted at the breakpoint, we can do the same things we already did with Pry, like:
- Going to the next line (F8 instead of “
next”) - Adding other breakpoints
- Using advantages of the IDE. For example Cmd+B on MacOS (or Ctrl+B on Linux/Windows) to go to the method definition.
Using IDE debugger is somewhat easier than using Pry. However, there can be some dance around setting this up. Some options are located not in the very obvious places:
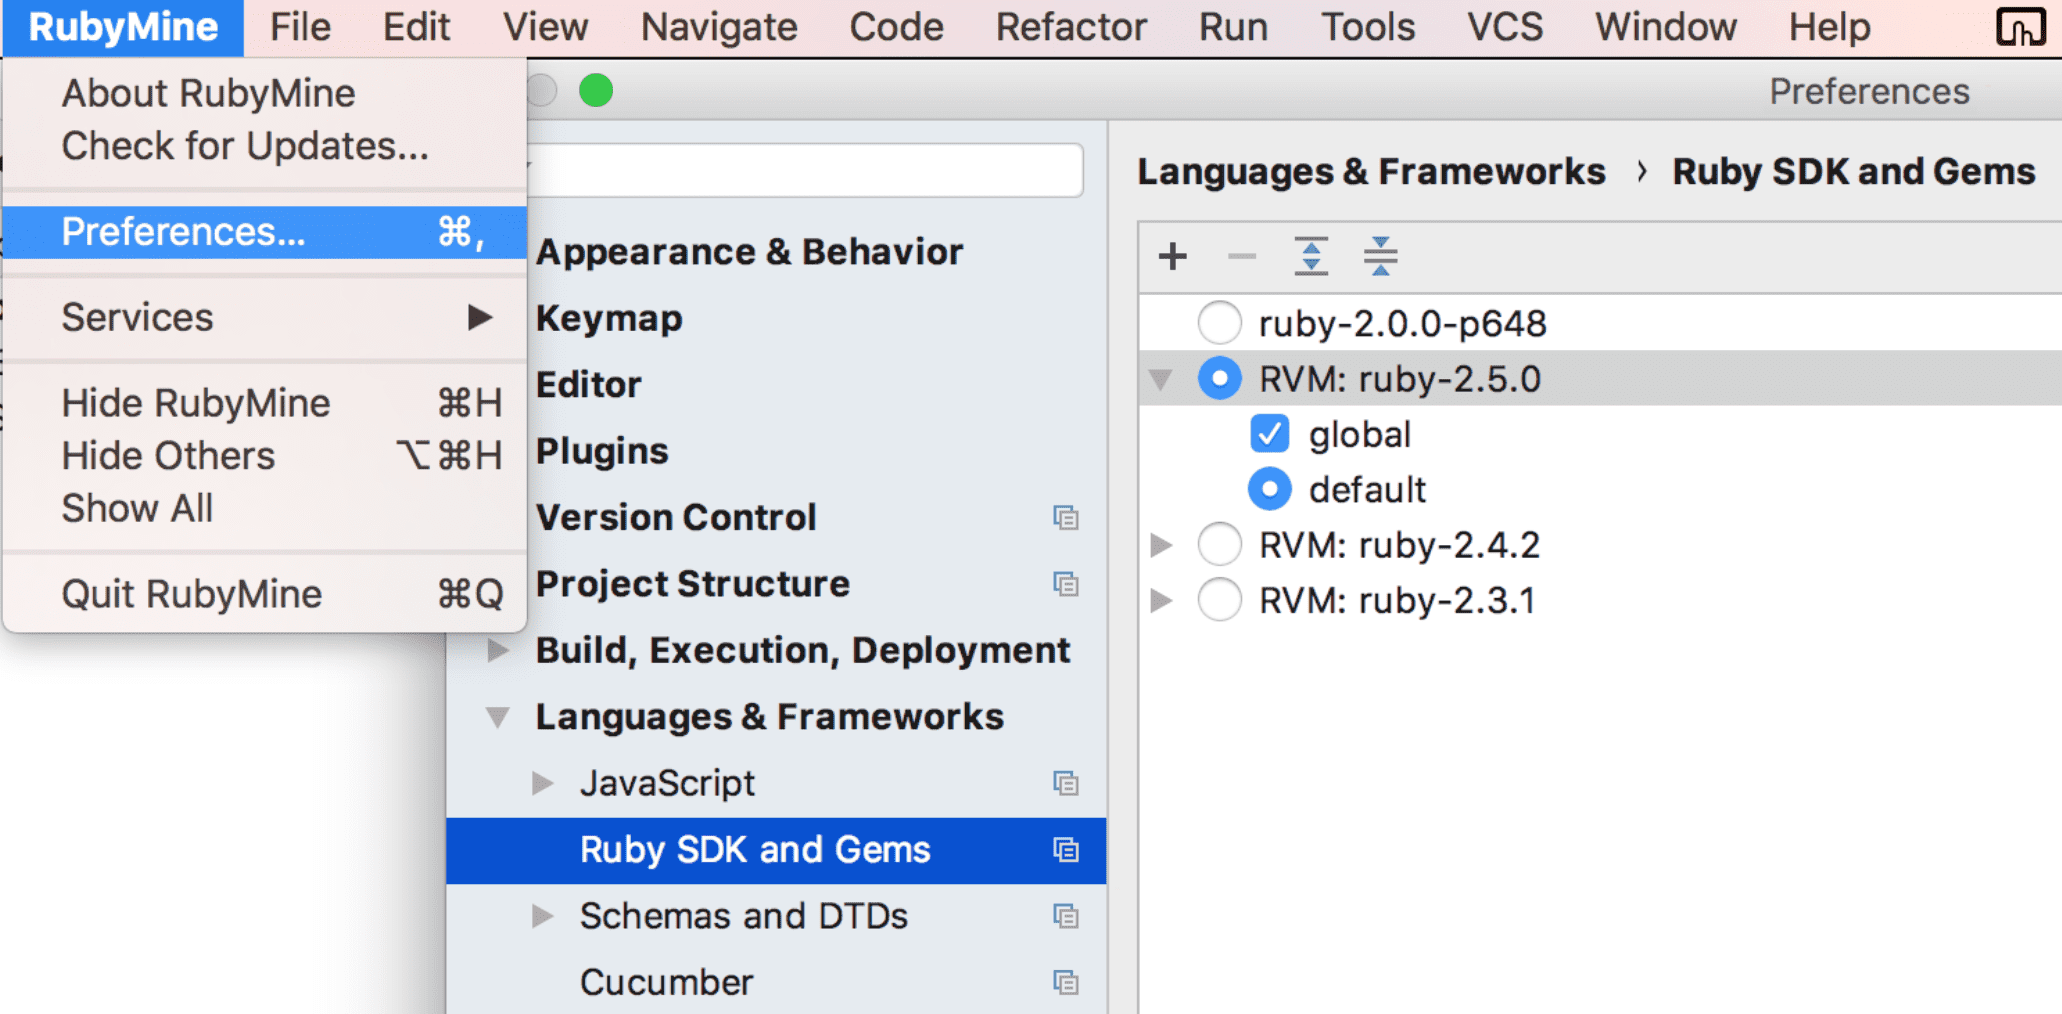
From the other side, it’s a matter of habit. RubyMine requires subscription and customer support is always ready to answer your question.
At the moment of writing there is also a free way of installing RubyMine available. It can be done though an EAP - Early Access Program. You will need to install Jetbrains Toolbox first to unlock this feature. After that, icon of the app with “EAP” label can be picked up from the dropdown menu:
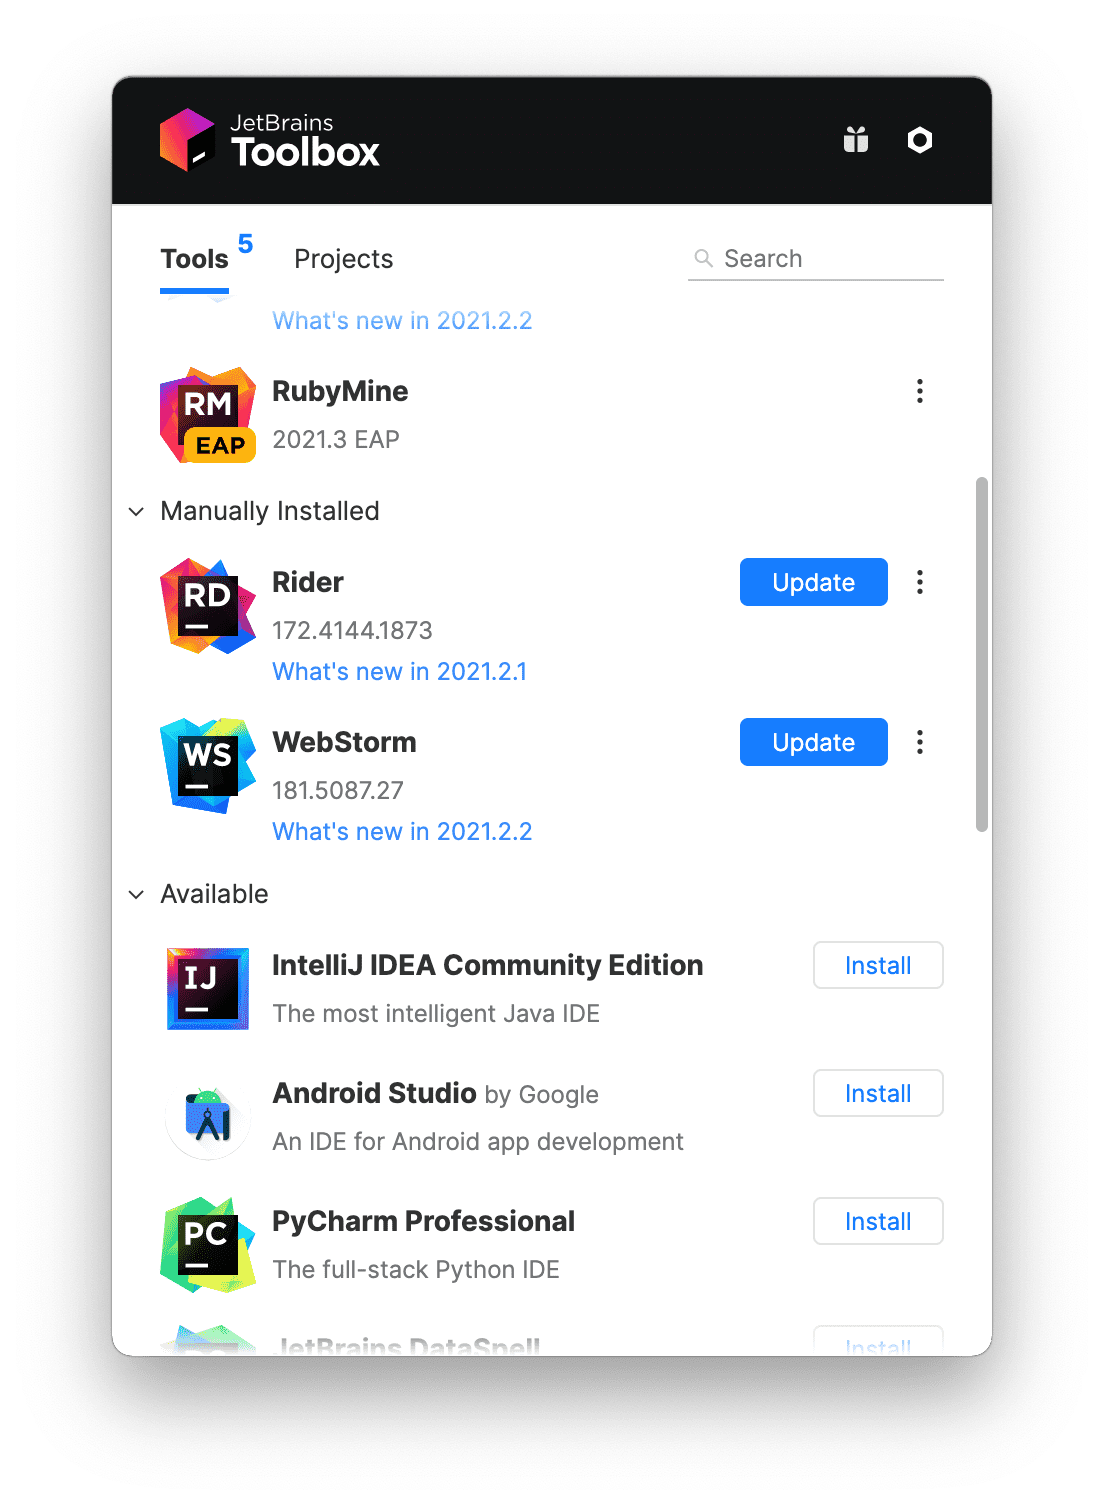
You might need to update this tool the similar way every month or so.
The similar debugging functionality is available through free and open source tool called VsCode (Visual Studio Code, not to confused with Visual Studio) from Microsoft.